
Table of Contents
- NIJ Market Survey of Offender Tracking Systems: A Comprehensive Analysis
- Background: Why This Survey Matters
- Industry Landscape at the Time of Survey
- Market Consolidation
- Migration to One-Piece Architecture
- Cross-Industry Technical Benchmarks
- Physical Characteristics
- Battery and Power Performance
- Performance and Accuracy
- Technology Feature Distribution
- Geo-Location Technologies
- Tamper Detection Mechanisms
- Alert Types Available
- End-User Requirements: What Agencies Actually Need
- Future Trends Identified (and What Actually Happened)
- Implications for Today’s Procurement Decisions
- Frequently Asked Questions
- What is the NIJ Market Survey of Offender Tracking Systems?
- What was the average GPS accuracy of ankle monitors in the NIJ survey?
- How has ankle monitor technology changed since the NIJ survey?
- References
- Further Reading
- Cite This Article
NIJ Market Survey of Offender Tracking Systems: A Comprehensive Analysis
What the landmark Johns Hopkins / NIJ study reveals about GPS ankle monitor technology, vendor capabilities, and industry benchmarks.
Based on: “Market Survey of Location-Based Offender Tracking Technologies, Version 1.1” (NIJ Award 2013-MU-CX-K111, Johns Hopkins University Applied Physics Laboratory, 2016)
Background: Why This Survey Matters
In 2013, the Johns Hopkins University Applied Physics Laboratory (JHU/APL) was commissioned by the National Institute of Justice to conduct the most comprehensive market survey ever undertaken of offender tracking system (OTS) technologies. Published in 2016, the resulting 166-page report (NCJ 249889) remains the foundational reference for any agency evaluating GPS ankle monitor technology.
The survey examined 16 products from 13 vendors, collecting data across 61 standardized evaluation criteria organized into five categories: Vendor Information, Product Information, Usability, Features and Functions, and Performance and Security. The methodology included vendor interviews, end-user interviews (Maryland DOC, U.S. ICE, Montgomery County), a Federal Register Request for Information (RFI), and extensive literature review.
This article provides an in-depth analysis of the survey’s findings, updated with context about how the industry has evolved in the decade since publication.
Industry Landscape at the Time of Survey
The NIJ survey documented several critical observations about the OTS market:
Market Consolidation
The survey captured an industry in the middle of significant consolidation:
- 3M Electronic Monitoring had acquired both Pro Tech and Elmo Tech
- BI Incorporated was owned by the GEO Group (prison services conglomerate)
- Track Group had absorbed SecureAlert, Emerge Inc., and G2 Research
- Sentinel Offender Services had purchased G4S Court Services (which had previously acquired ActSoft and Guidance)
- OmniLink was acquired by Numerix Corp
- Satellite Tracking of People (STOP LLC) was owned by Securus Technologies
- Gryphex (formerly Ascend) was acquired by Alcohol Monitoring Systems (SCRAM manufacturer)
This consolidation pattern has continued through 2026, with further mergers reducing the number of independent OTS vendors. Today, the market is dominated by a handful of large integrated service providers and a smaller number of specialized hardware manufacturers.
Migration to One-Piece Architecture
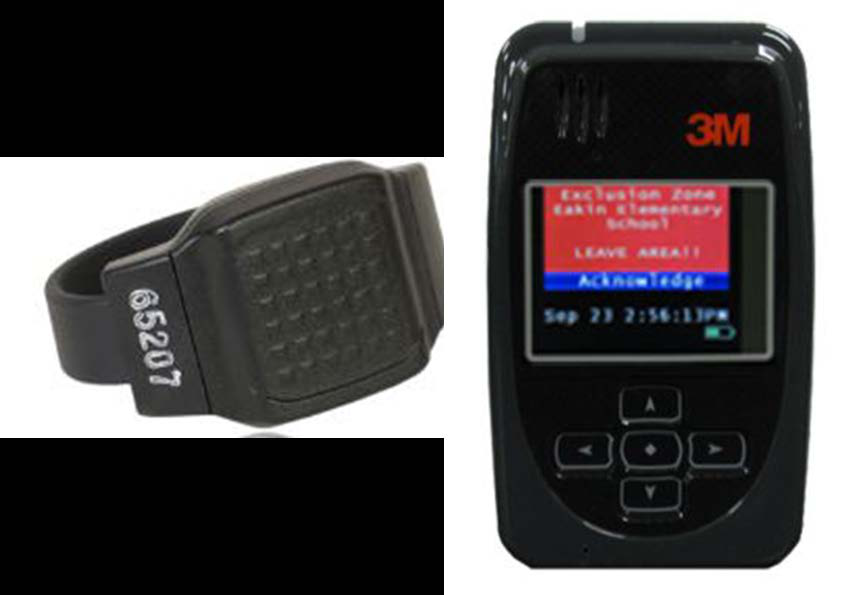
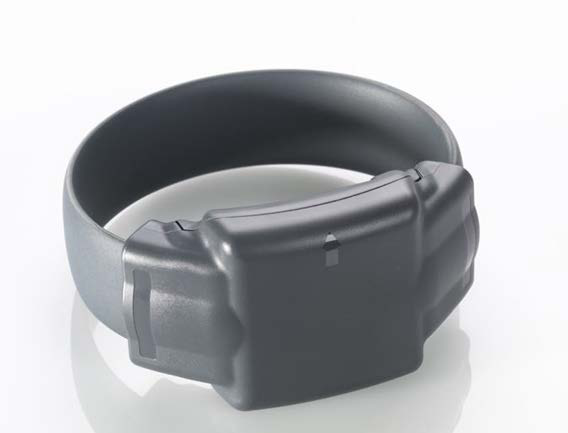
Even in 2016, vendor interviews noted that “the market seems to be migrating toward a one-piece model.” The survey data confirmed this trend: 12 of 16 products surveyed were one-piece designs, while only 4 were two-piece configurations. By 2026, one-piece devices represent over 65% of new procurement specifications.
Cross-Industry Technical Benchmarks
The survey’s most valuable contribution is its standardized cross-industry comparison data. These benchmarks, drawn from Tables 2 and 3 of the original report, provide the only NIJ-endorsed baseline for comparing OTS capabilities:
Physical Characteristics
| Parameter | Average | Minimum | Maximum | Sample Size |
|---|---|---|---|---|
| Device Height | 3.38 inches | 1.77″ | 4.72″ | 12 |
| Device Width | 2.49 inches | 1.96″ | 3.68″ | 10 |
| Device Depth | 1.17 inches | 0.51″ | 1.89″ | 11 |
| Device Weight | 5.60 oz (159g) | 1.80 oz (51g) | 9.70 oz (275g) | 15 |
| Waterproof Depth | 35.4 feet | 3 ft | 100 ft | 10 |
2026 Context: Modern one-piece devices have pushed these boundaries significantly. For example, the latest generation of one-piece GPS ankle monitors weighs as little as 108g (3.8 oz) — well below the 2016 survey average of 159g. The miniaturization trend identified in the survey’s “Future Trends” section has clearly materialized.
Battery and Power Performance
| Parameter | Average | Min | Max |
|---|---|---|---|
| Battery Discharge Time | 41.2 hours | 20 hours | 72 hours |
| Battery Shelf Life | 44.5 months | 24 months | 120 months |
| Recharge Time | 2.25 hours | 0.75 hours | 4 hours |
| On-Device Data Storage | 13.1 days | 0.8 days | 30 days |
2026 Context: Battery life was the most critical limitation in 2016, with the average device lasting only 41.2 hours (under 2 days). The current generation of LTE-M/NB-IoT devices has extended this to 7 days for standalone GPS tracking — a 4x improvement. BLE-connected modes can extend battery life to 6 months, a paradigm shift from the 2016 baseline.
Performance and Accuracy
| Parameter | Average | Min | Max |
|---|---|---|---|
| Installation Time | 4.39 minutes | 0.5 min | 20 min |
| Locational Accuracy | 15.6 feet (4.75m) | 6 ft (1.83m) | 32.8 ft (10m) |
| Alert-to-Notification Time | 50 seconds | 30 sec | 60 sec |
Technology Feature Distribution
The survey cataloged which features were available across the 16 products surveyed. Key findings include:
Geo-Location Technologies
- GPS: 16/16 products (100%) — universal standard
- Cellular-based positioning: 11/16 (69%) — tower trilateration as fallback
- RF (Radio Frequency): 9/16 (56%) — for home curfew monitoring
- Wi-Fi positioning: 2/16 (13%) — rare in 2016, now common
Tamper Detection Mechanisms
- Fiber optic: 7/16 products (44%)
- Light sensor: 3/16 (19%)
- Tamper plug: 2/16 (13%)
- Ultrasound detection: 1/16 (6%)
The finding that fiber optic tamper detection was already present in 44% of products in 2016 is significant. By 2026, fiber optic has become the gold standard for tamper detection, with agencies increasingly specifying it as a mandatory RFP requirement due to its zero false-positive rate.
Alert Types Available
- Exclusion zone: 14/16 (88%)
- Strap tamper: 14/16 (88%)
- Inclusion zone: 10/16 (63%)
- Battery: 10/16 (63%)
- Device case tamper: 9/16 (56%)
- Schedule violation: 6/16 (38%)
- Communication signal loss: 5/16 (31%)
- Jamming/shielding: 4/16 (25%)
- Victim proximity: 1/16 (6%)
End-User Requirements: What Agencies Actually Need
Perhaps the most operationally valuable section of the NIJ survey is the end-user interview data. Interviews with Maryland Department of Public Safety, U.S. Immigration and Customs Enforcement, and Montgomery County DOC revealed that agencies prioritize different features based on the offender population they supervise:
| Offender Type | Primary Concern | Most Important OTS Features |
|---|---|---|
| DUI / Functional Alcoholic | Getting back to work, supporting family | Schedule/timing compliance |
| Drug Dealer | Preventing return to known drug areas | GPS accuracy, exclusion zones, data analysis |
| Sexual Offender | Knowing exact location at all times | GPS accuracy, reporting frequency, exclusion zones, victim notification |
| Reintegrating Individual | Avoiding stigmatization | Device size, weight, comfort, discretion |
This offender-type-to-feature mapping remains the NIJ’s most practical guidance for agencies designing their monitoring programs. The survey explicitly concluded that “it was extremely important to engage in a critical analysis of the agency’s mission and objective when considering the acquisition of OTSs.”
Future Trends Identified (and What Actually Happened)
Section 6 of the NIJ survey identified future trends. Here is what has materialized by 2026:
| 2016 Prediction | 2026 Reality | Status |
|---|---|---|
| Smaller and lighter units | Average weight dropped from 159g to under 110g for leading devices | Realized |
| More efficient batteries | LTE-M/NB-IoT reduced power consumption; 7-day battery life achieved | Realized |
| Continuing evolution of one-piece | 65%+ of new procurements specify one-piece | Realized |
| Wi-Fi backup | Wi-Fi positioning now standard on most devices | Realized |
| Additional satellite channels | Quad-GNSS (GPS+GLONASS+Galileo+BeiDou) now standard | Realized |
| Better indoor tracking | Wi-Fi + LBS + BLE positioning improve indoor coverage | Partially Realized |
| Signal jamming detection | GPS + cellular jamming detection available on premium devices | Realized |
| Alternative to ankle tethering | Smartphone monitoring apps for low-risk; wrist-worn BLE for prison | Partially Realized |
| NIJ Standard 1004.00 publication | Standard published; establishes 10m outdoor / 30m indoor benchmarks | Realized |
Implications for Today’s Procurement Decisions
While the specific products surveyed in 2016 have largely been superseded, the NIJ survey’s evaluation framework remains directly applicable. Agencies preparing new RFPs should use the survey’s 61-item evaluation criteria as a starting point, updated for current technology:
- Mandate LTE-M/NB-IoT connectivity — 2G/3G networks have been decommissioned
- Require multi-GNSS positioning — GPS-only is no longer acceptable
- Specify fiber optic tamper detection — zero false-positive technology is available
- Demand IP68 waterproofing — the 2016 average of 35 feet is obsolete
- Set minimum 7-day battery life — the 2016 average of 41 hours is unacceptable
- Require sub-3-minute installation — tool-free snap designs are now standard
Frequently Asked Questions
What is the NIJ Market Survey of Offender Tracking Systems?
The NIJ Market Survey is a comprehensive evaluation of GPS ankle monitoring technology conducted by the Johns Hopkins University Applied Physics Laboratory under NIJ Award 2013-MU-CX-K111. Published in 2016, it examined 16 products from 13 vendors across 61 standardized criteria, including physical characteristics, battery performance, GPS accuracy, tamper detection, and software capabilities.
What was the average GPS accuracy of ankle monitors in the NIJ survey?
The average locational accuracy across surveyed devices was 15.6 feet (4.75 meters), with a range from 6 feet (1.83m) to 32.8 feet (10m). Modern multi-GNSS devices achieve sub-2-meter accuracy, a significant improvement over the 2016 baseline.
How has ankle monitor technology changed since the NIJ survey?
Major improvements since 2016 include: battery life extended from 41 hours to 7+ days, weight reduced from 159g average to under 110g, cellular connectivity upgraded from 2G/3G to LTE-M/NB-IoT, GPS accuracy improved from 4.75m to sub-2m with quad-GNSS, and fiber optic tamper detection becoming the industry standard with zero false positives.
References
- Taylor, S.R., Kandaswamy, S., Evans, T., & Mahaffey, D. (2016). Market Survey of Location-Based Offender Tracking Technologies, Version 1.1. Johns Hopkins University Applied Physics Laboratory. NIJ Award No. 2013-MU-CX-K111. NCJ 249889.
- Brown, T.M., McCabe, S.A., & Wellford, C. (2007). GPS Technology for Community Supervision: Lessons Learned. Noblis / NIJ.
- DeMichele, M., & Payne, B. (2009). Offender Supervision with Electronic Technology [2nd ed.]. Bureau of Justice Assistance.
- National Institute of Justice. (2012). Selection and Application Guide to Offender Tracking Systems for Criminal Justice Professionals. NIJ Guide 1004.00 (draft).
Further Reading
- GPS Ankle Monitor Ultimate Guide
- GPS vs RF Ankle Monitor Comparison
- Ankle Monitor Tamper Detection Technology
Cite This Article
Ankle Monitor Industry Report. “NIJ Market Survey of Offender Tracking Systems: A Comprehensive Analysis.” Ankle Monitor Industry Report, March 2026.